Impact Score — proprietary On/Off composite metric. Identifies the player who moved the needle most for his team within this game, across key efficiency metrics.
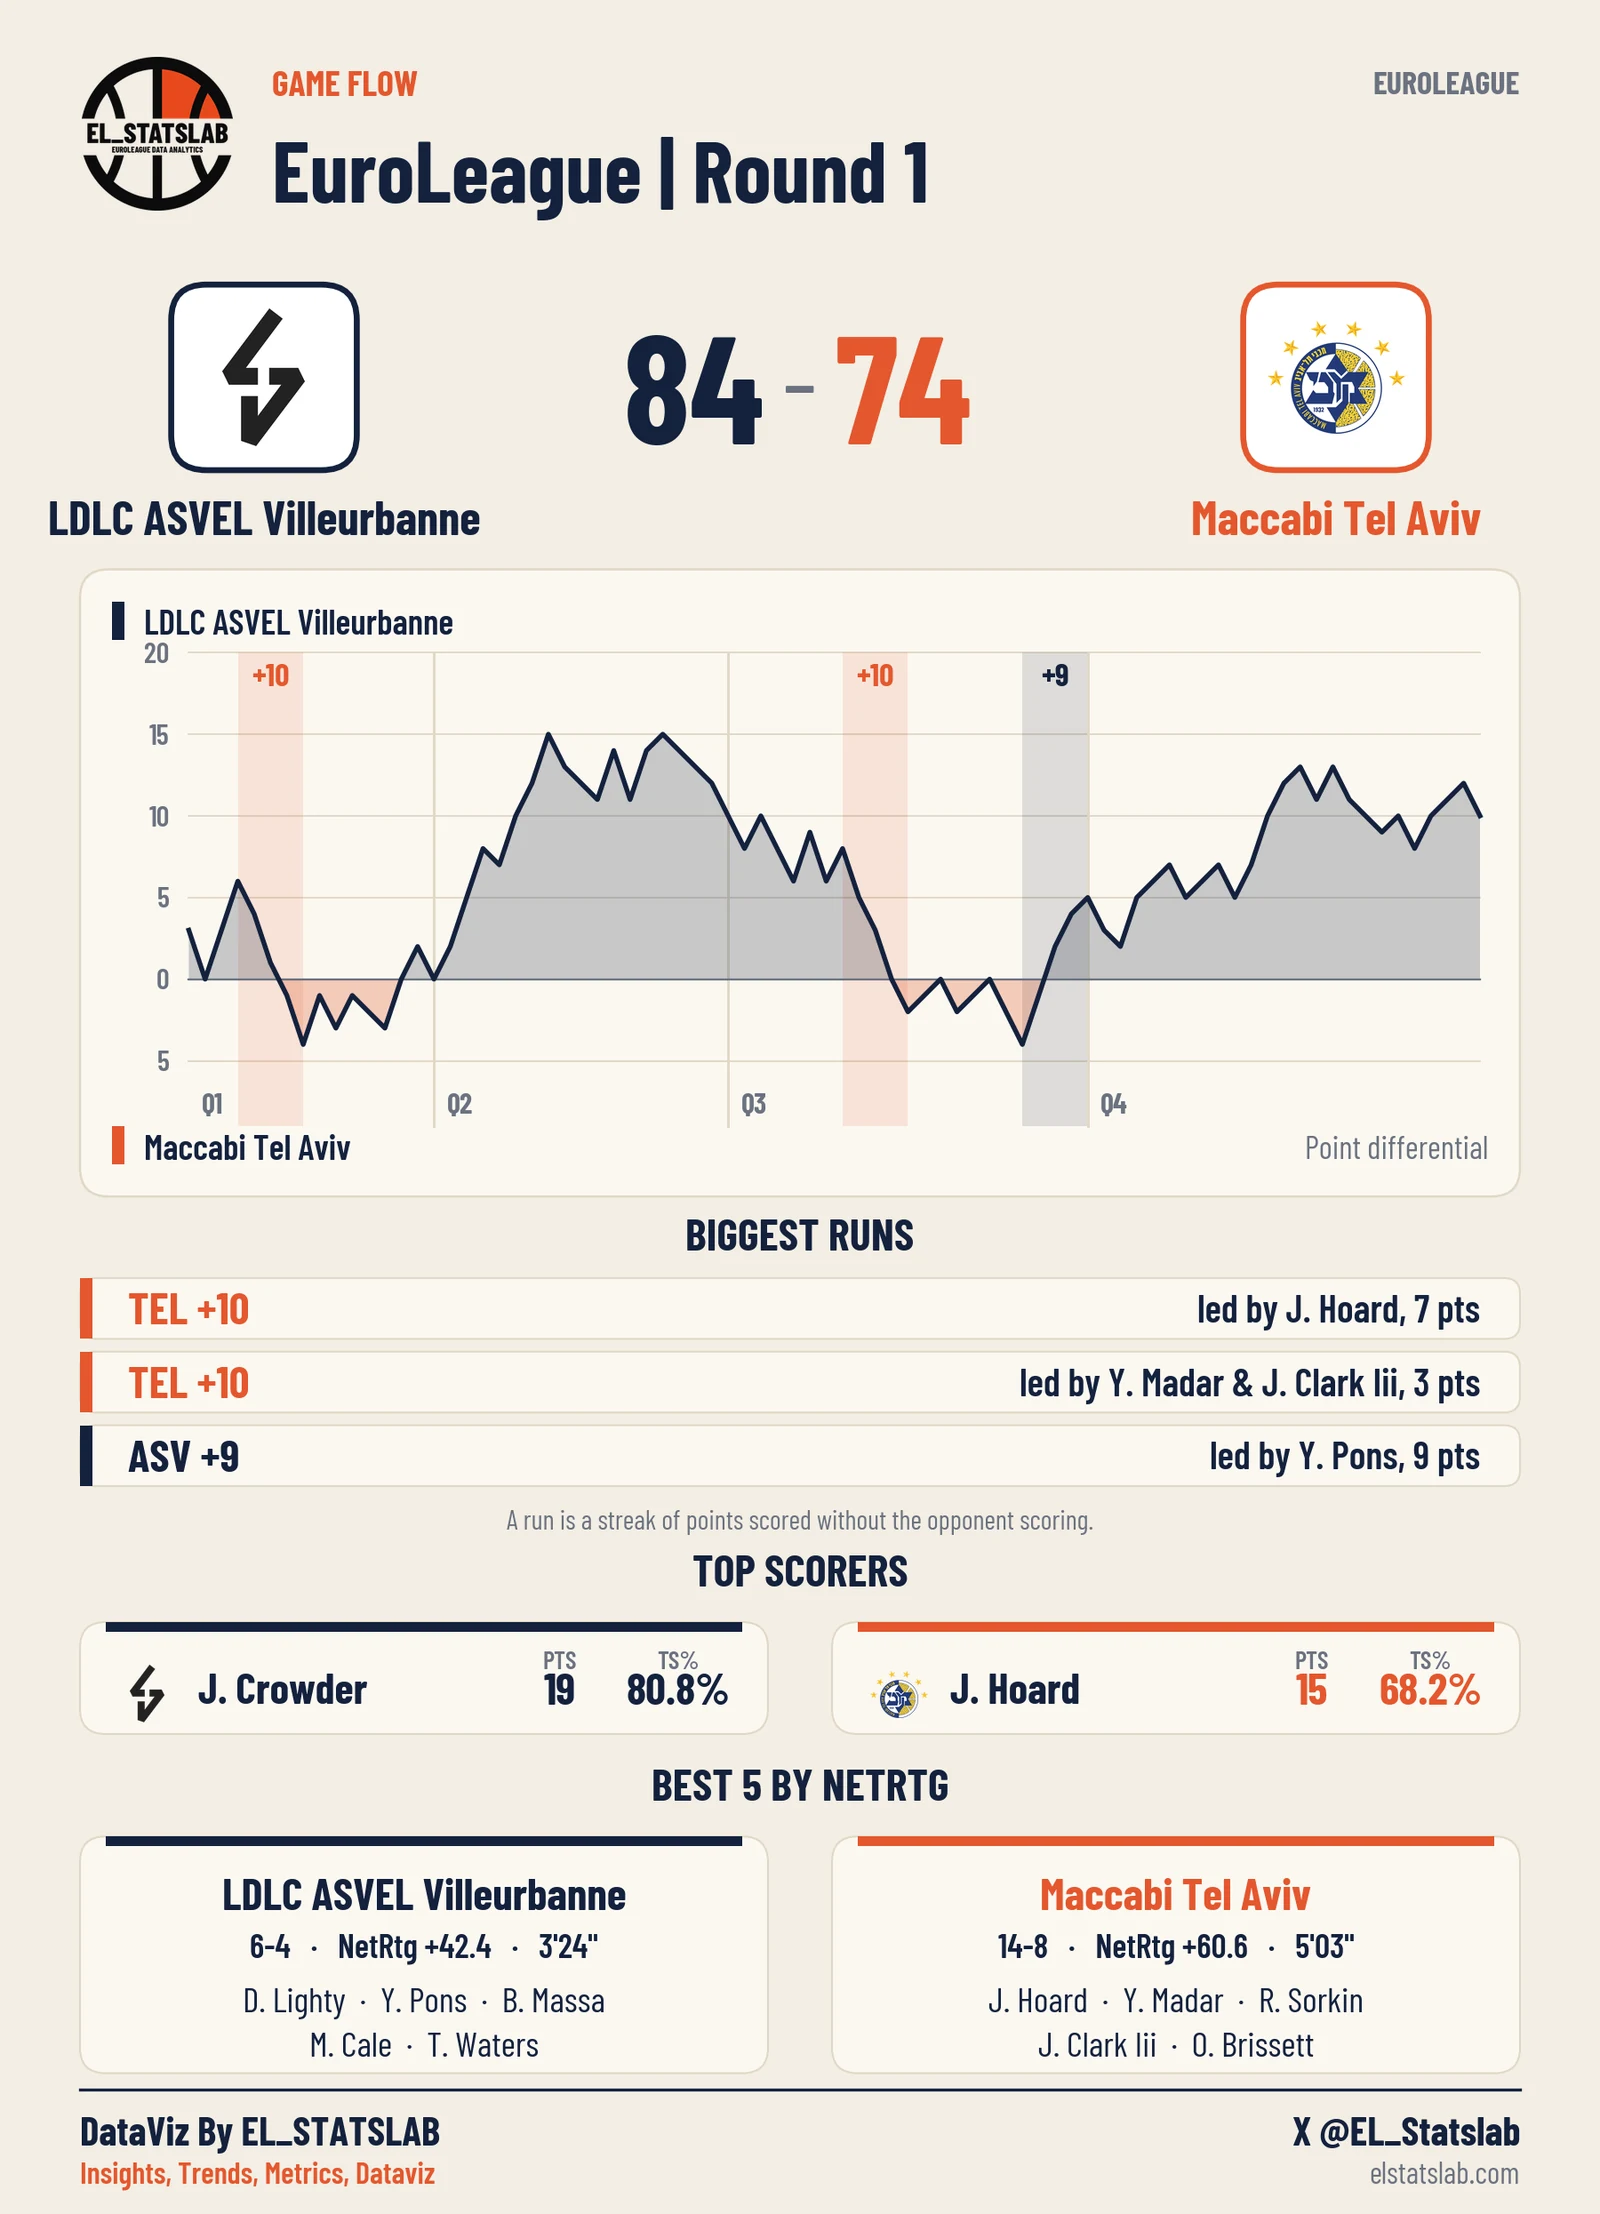
LDLC ASVEL Villeurbanne
H. Besson
Difference MakerImpact Score +0.93
33 poss ON · min. threshold 20 poss
METRIC
ON
OFF
DIFF
ORTG
129.2
96.4
+32.8
DRTG
65.2
113.4
-48.2
NETRTG
64.0
-17.0
+81.0
OREB%
26.7
10.5
+16.2
REB%
42.9
43.6
-0.7
AST%
76.9
71.4
+5.5
eFG%
65.4
56.2
+9.2
TOV%
18.0
21.2
-3.2
#
PLAYER
SCORE
NET ON
NET OFF
DIFF
POSS
1
H. Besson
+0.93
64.0
-17.0
+81.0
33
2
P. Mills
+0.65
25.0
9.9
+15.1
44
3
J. Bolomboy
+0.29
12.3
26.3
-14.0
46
4
D. Lighty
+0.17
30.9
8.1
+22.8
30
5
Y. Pons
+0.06
41.1
8.3
+32.8
24
6
M. Fodzo Dada
-0.07
10.8
26.7
-15.9
40
7
J. Crowder
-0.17
4.9
41.8
-36.9
46
8
T. Waters
-0.40
16.6
20.1
-3.5
30
9
B. Massa
-0.63
18.1
17.8
+0.3
27
10
B. Gach
-0.85
-39.7
56.1
-95.8
33
Maccabi Tel Aviv
Y. Madar
Difference MakerImpact Score +1.52
51 poss ON · min. threshold 20 poss
METRIC
ON
OFF
DIFF
ORTG
118.0
48.7
+69.3
DRTG
111.1
110.4
+0.7
NETRTG
6.9
-61.7
+68.6
OREB%
33.3
27.8
+5.5
REB%
62.9
50.0
+12.9
AST%
73.9
40.0
+33.9
eFG%
67.9
20.8
+47.1
TOV%
23.6
27.8
-4.2
#
PLAYER
SCORE
NET ON
NET OFF
DIFF
POSS
1
Y. Madar
+1.52
6.9
-61.7
+68.6
51
2
R. Sorkin
+1.15
10.9
-50.0
+60.9
42
3
I. Lundberg
+0.45
-8.0
-30.0
+22.0
44
4
J. Hoard
+0.30
-12.5
-30.1
+17.6
56
5
O. Brissett
+0.21
-2.9
-47.5
+44.6
53
6
J. Clark Iii
+0.11
-8.1
-23.4
+15.3
29
7
D. Theis
-0.12
-14.8
-19.5
+4.7
33
8
W. Rayman
-0.30
-10.0
-21.1
+11.1
21
9
K. Wallace
-1.09
-69.1
5.7
-74.8
24
Units by NetRtg (ORTG minus DRTG per 100 possessions). Minimum 3 min together for a five man unit, 6 for a trio and 10 for a duo. If no five clears the possession minimum, fives with 3 minutes or more are shown and marked LOW SAMPLE. A single match is a small sample, read it with care.
LDLC ASVEL Villeurbanne
BEST 5
+42.4
NET RATING
D. Lighty
Y. Pons
B. Massa
M. Cale
T. Waters
ORTG
93.2
DRTG
50.8
MIN
3.1
GP
1
WORST 5
-47.2
NET RATING
J. Bolomboy
B. Gach
M. Fodzo Dada
P. Mills
J. Crowder
ORTG
113.9
DRTG
161.1
MIN
8.7
GP
1
BEST TRIO
P. Mills, H. Besson, J. Crowder
6.9 MIN · ORTG 155.8 · DRTG 71.6
+84.2
NET
BEST DUO
D. Lighty, T. Waters
11.6 MIN · ORTG 95.0 · DRTG 60.0
+35.0
NET
Maccabi Tel Aviv
BEST 5
+60.6
NET RATING
J. Hoard
Y. Madar
R. Sorkin
J. Clark Iii
O. Brissett
ORTG
140.0
DRTG
79.4
MIN
5.0
GP
1
WORST 5
-48.6
NET RATING
D. Theis
I. Lundberg
W. Rayman
O. Brissett
K. Wallace
ORTG
68.0
DRTG
116.7
MIN
3.2
GP
1
BEST TRIO
J. Hoard, I. Lundberg, Y. Madar
7.5 MIN · ORTG 163.7 · DRTG 100.0
+63.7
NET
BEST DUO
Y. Madar, O. Brissett
13.0 MIN · ORTG 132.4 · DRTG 89.8
+42.5
NET
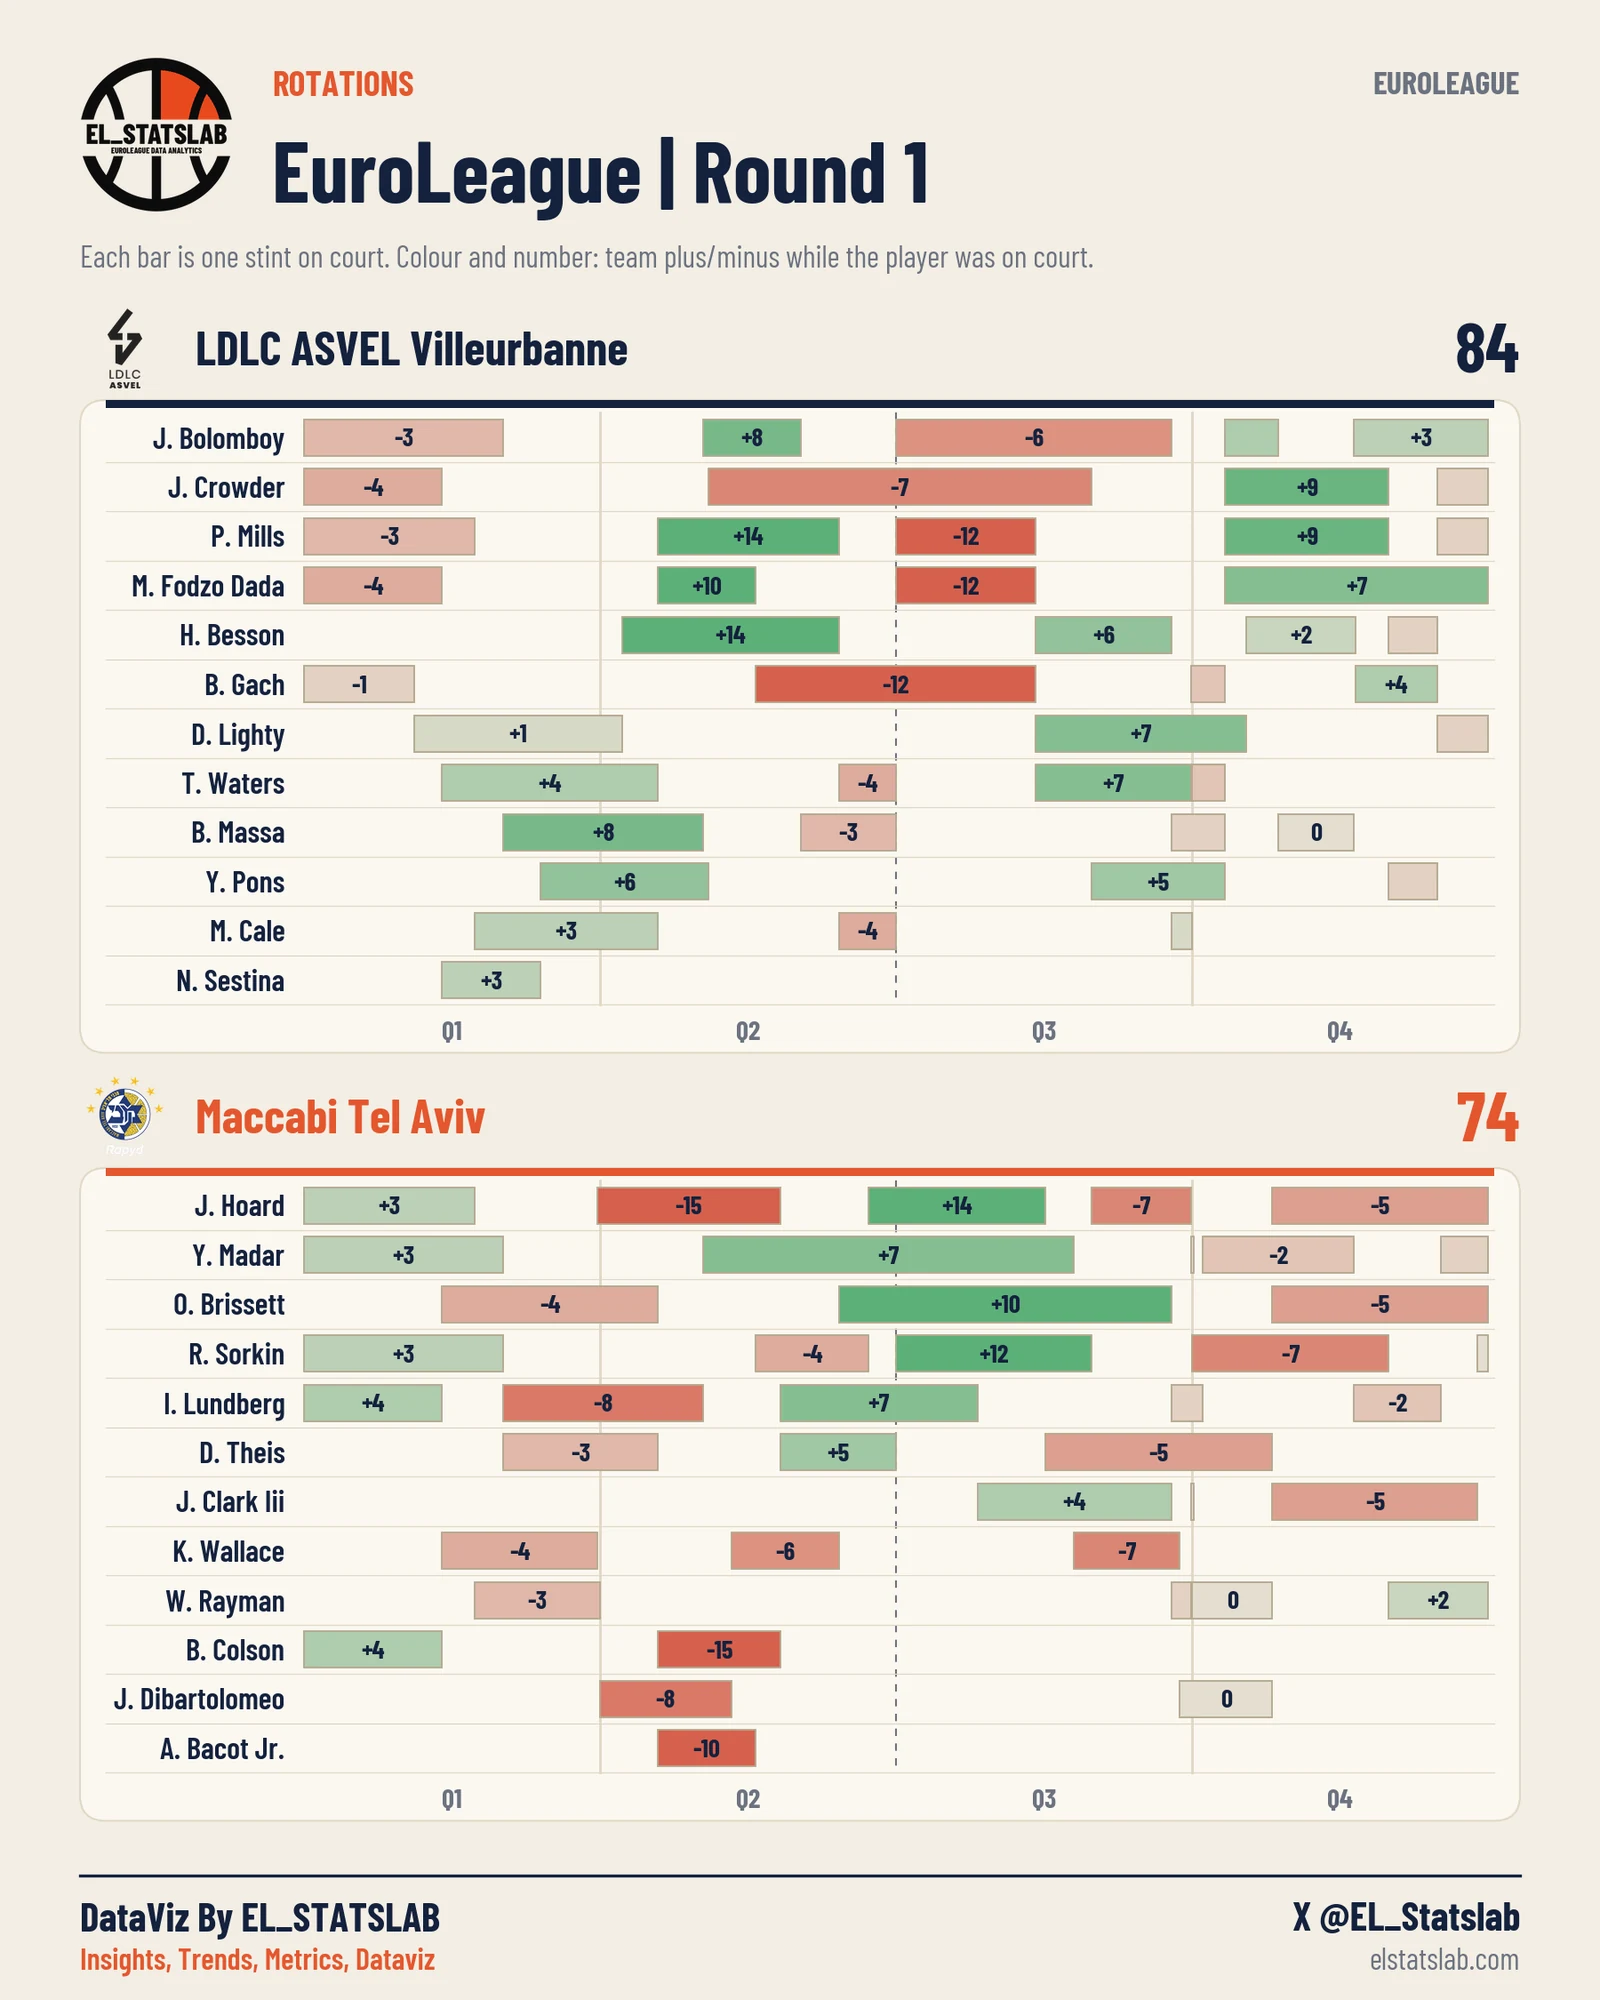
Who was on court and when. Each bar is one stint, colour and number show the team plus/minus while the player was on court.
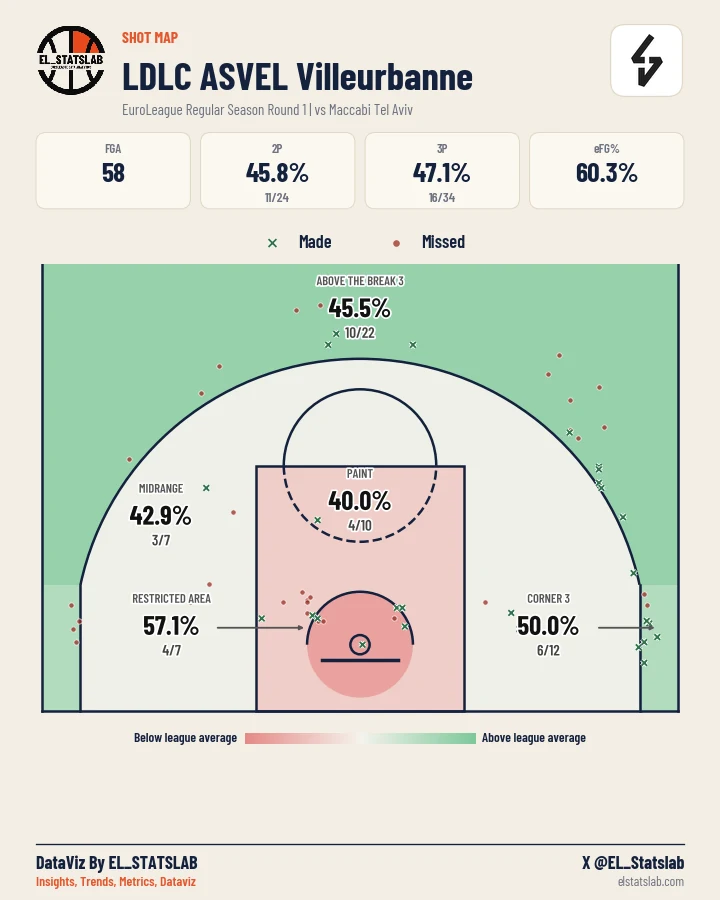
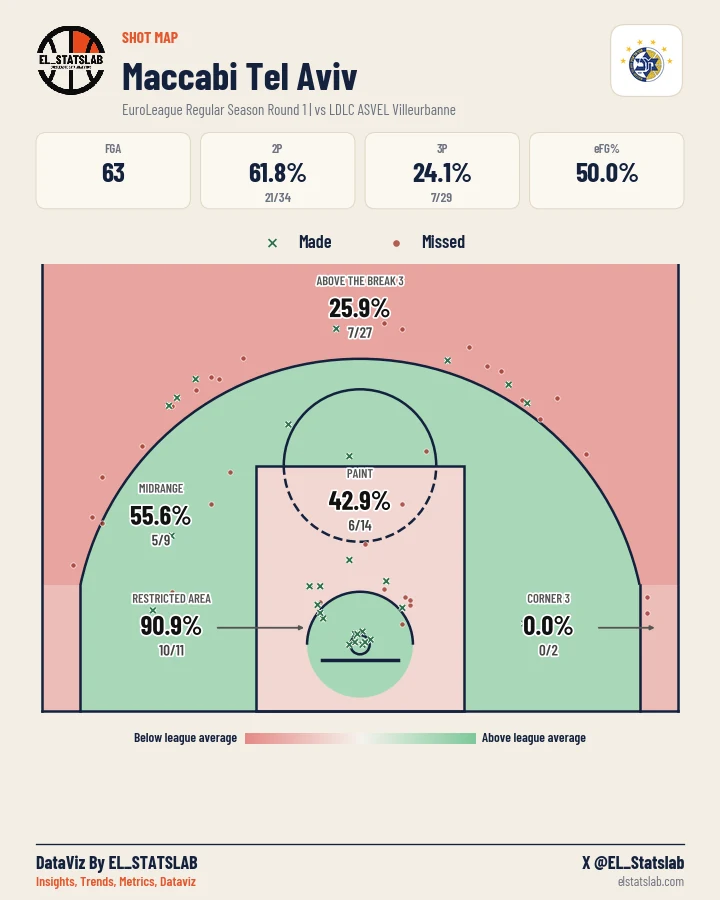
Zone colour compares each team's FG% in that zone with the league average. Green cross: made shot. Red circle: missed shot.
 ELSTATSLAB
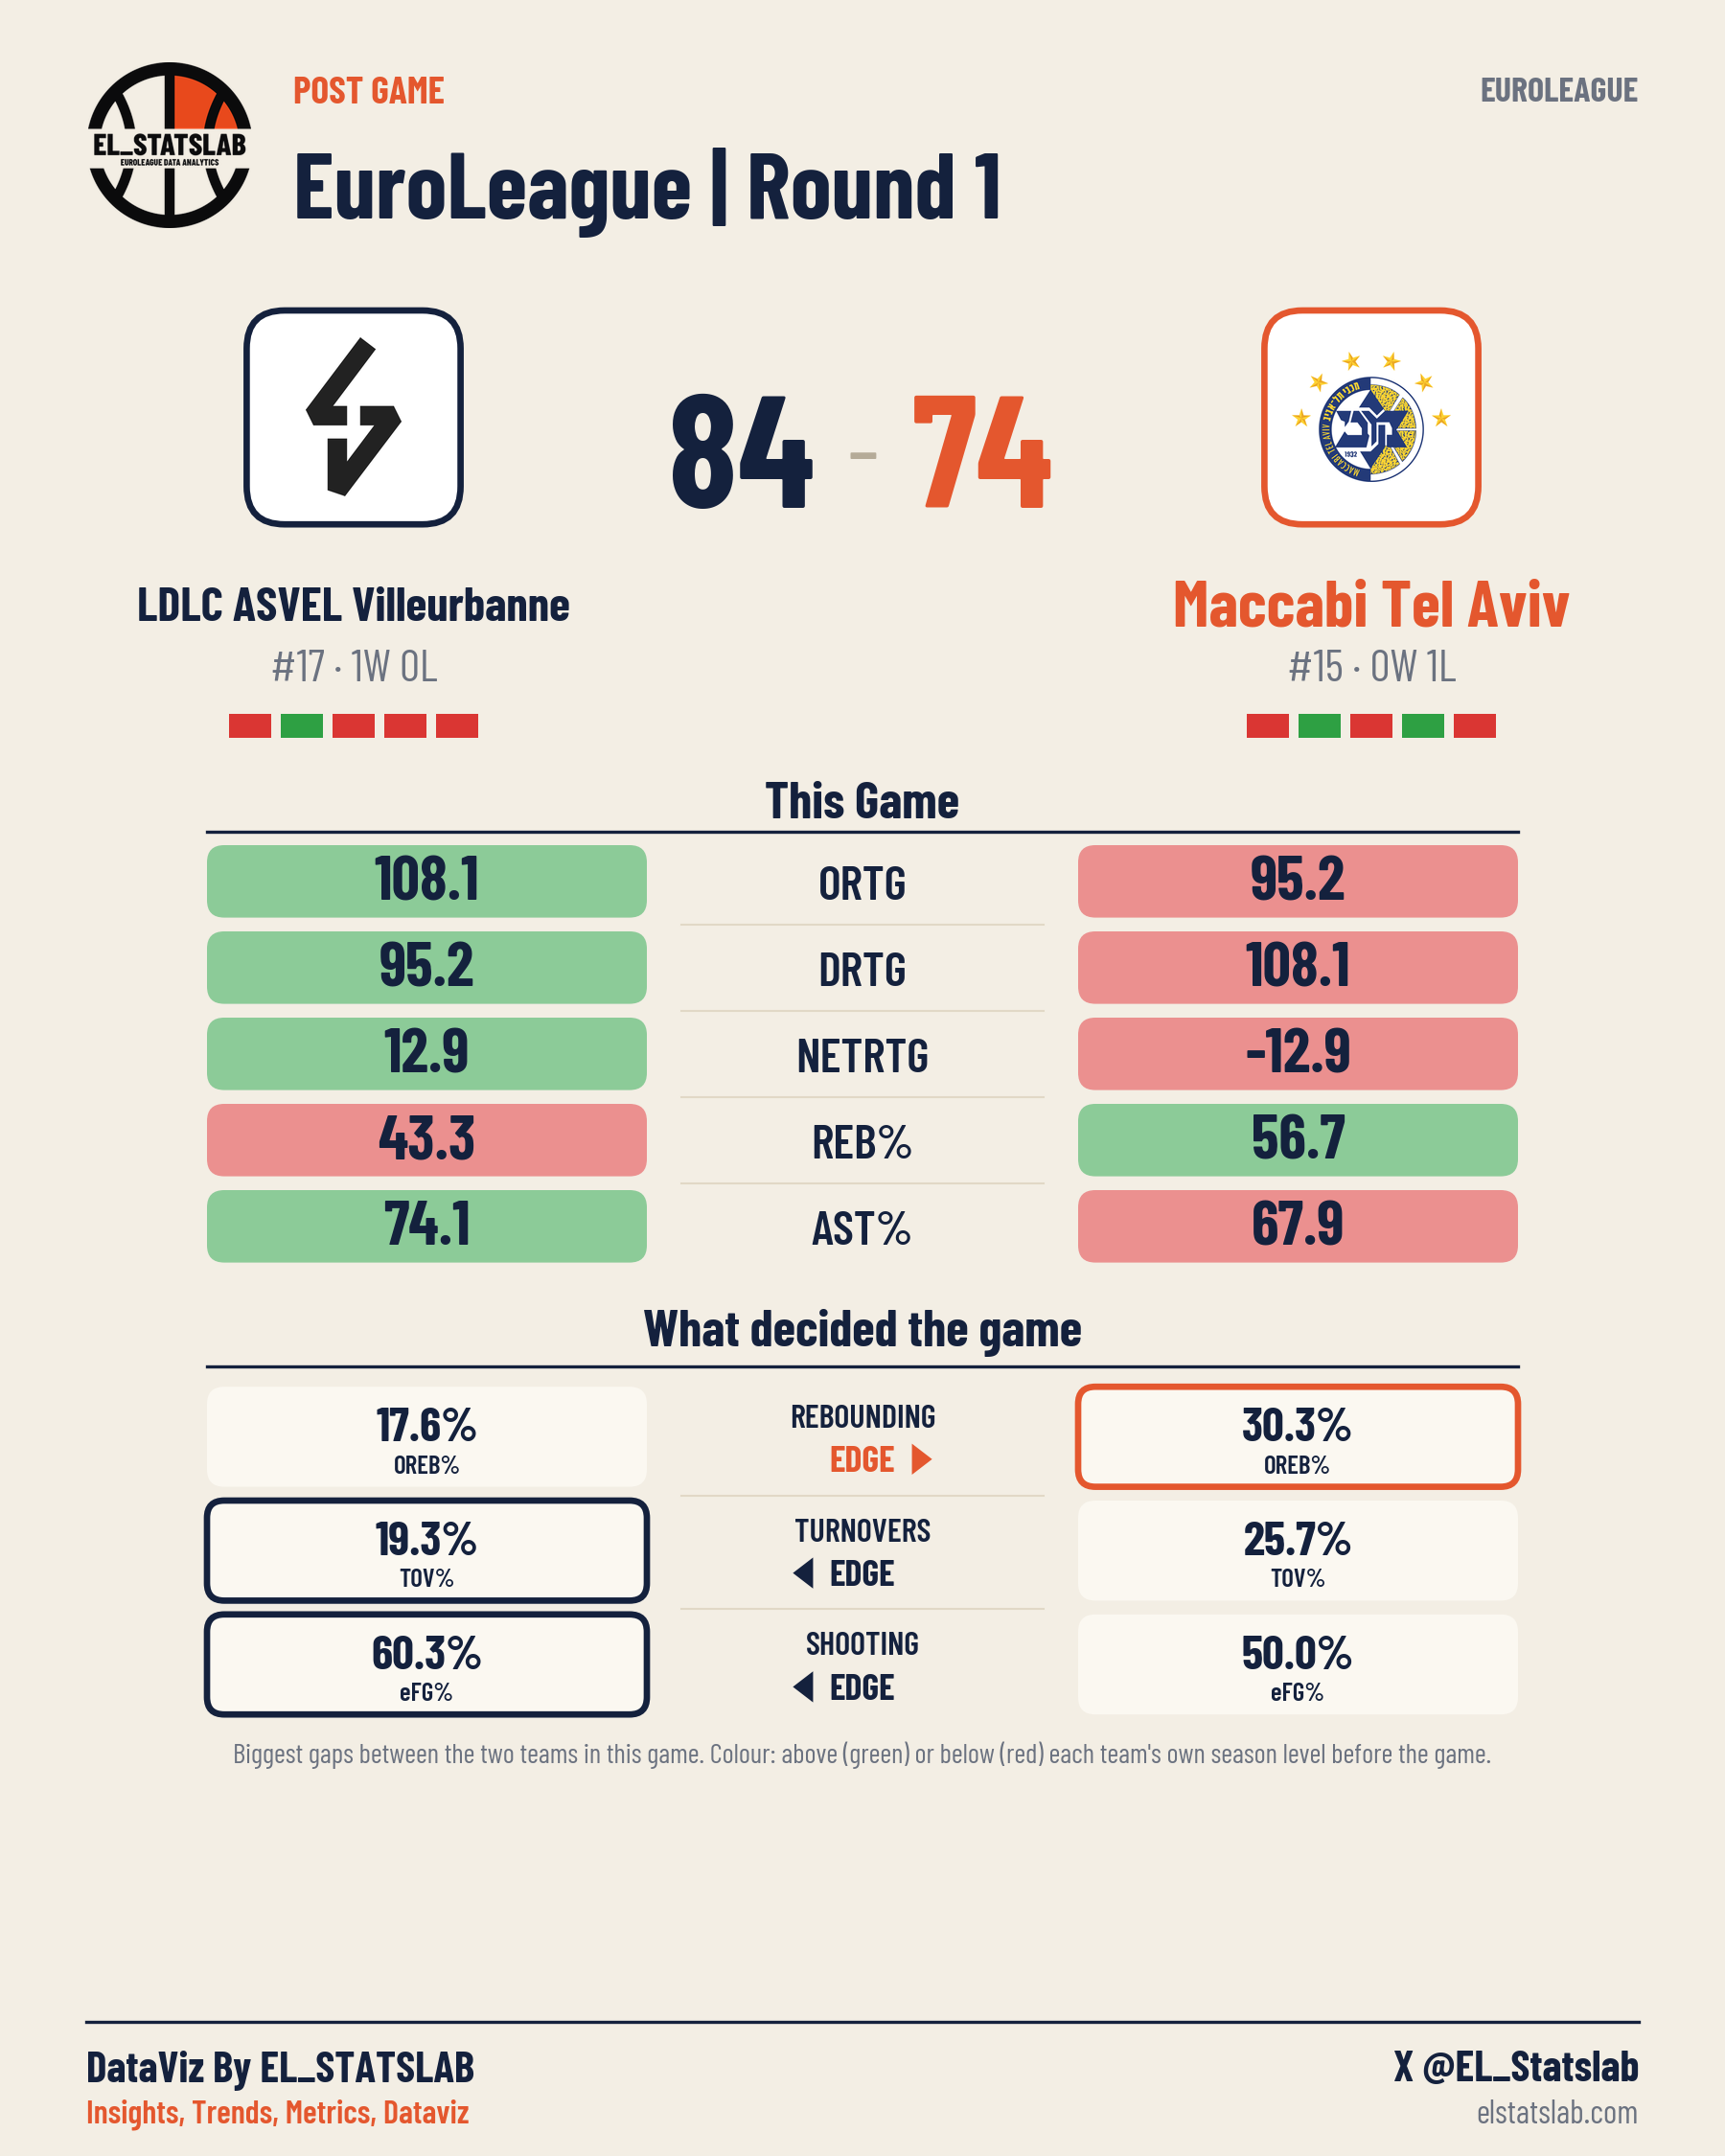
 LDLC ASVEL Villeurbanne#17 · 1W 0L
 Maccabi Tel Aviv#15 · 0W 1L